Elliott Wave Theory
Technical analysis is a relatively young type of analysis, but it has already
gathered a significant number of followers – especially in the forex
market. The basic premise of technical analysis is that historical price
action may predict the price action in the future. That means, all you need to
make a trading decision is to just looking at the chart! The forex market,
being open 24 hours a day, creates a lot of data that can be analyzed with
technical analysis, making it such a popular type of analysis in this market.
Technical analysis involves studying price trends, charts, indicators, support
and resistance etc. and will be covered in detail in the next lessons.
Fundamental analysis
The Elliott Wave Theory, named after Ralph Nelson Elliott, is a theory which suggests that financial markets (including the forex market) trade in repetitive cycles which are influenced by the overall psychology of the market participants in the market. According to Elliott, the upward and downward swings in the markets are caused by the expectations of the masses, forming an identifiable pattern of price movement which Mr.Elliott named the 5-3 wave pattern. This means that by correctly identifying the repetitive cycles, traders can predict where the price will move next.
These repetitive cycles are called “waves”, which can be further divided into impulse waves and corrective waves.
Impulse and Corrective Waves
The first 5 waves in the “5-3 wave pattern” are called impulse waves, while the last 3 waves are called corrective waves.
Among the first 5 waves, waves 1, 3 and 5 are motivated, which means the follow the direction of the trend, while waves 2 and 4 are correct.
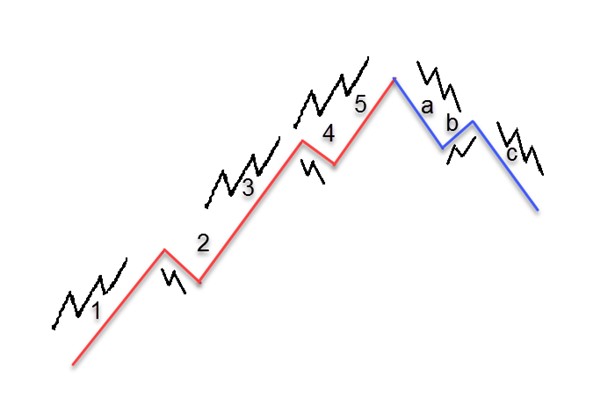
Let's take a look at the 5-3 wave pattern in the following graphic.

Wave 1 is the first wave of the pattern, which forms when a small number of
people feel that the price is low and start to buy the financial instrument,
causing the price to rise. At wave 2, some of the investors from the initial
wave felt that the security became overvalued, and started taking profits,
causing the price to fall. Wave 3, which is usually the longest wave, signals
that the security caught the attention of the mass public, who enter the
market and cause to price to rise again. At wave 4, some of the market
participants take profits again, forming a new corrective wave. And finally,
wave 5 is mostly driven by hysteria, where the mass public start buying again
on various beliefs that the stock is still a bargain.
This is where traders whose trading decisions are based on analysis and not on following the crowd start to sell the security, forming the first correction move (a). The security makes a new high at point (b) again, before it continues its correction wave (c), with the price further falling down. There are some important rules which you should pay attention to:
- Wave 3 can never be the shortest impulse wave
- Wave 2 can never break below the start of Wave 1
- Wave 4 can never enter into the same price area as Wave 1.
- This was the brief explanation of the Elliott wave theory and its impulse (1,2,3,4,5) and corrective waves (a,b,c)
fractals
It's important to note that Elliott waves are made of smaller waves, which in turn are made of even smaller waves and so on. These smaller waves are called fractals. They look the same as the longer waves, which means they are also made of impulse and corrective waves. The following picture shows the concept of fractals inside Elliott waves.
While looking at a chart, you will probably not see perfect waves right away. Instead, as each wave consists of smaller waves, which also consist of smaller waves etc., you need to look for the 5-3 wave pattern. Knowing how the whole cycle of Elliott waves looks like, it will be much easier for you to spot and trade this rewarding technical concept.
How to Trade with Elliott Waves
Let's say you open up your trading platform and see something like this.
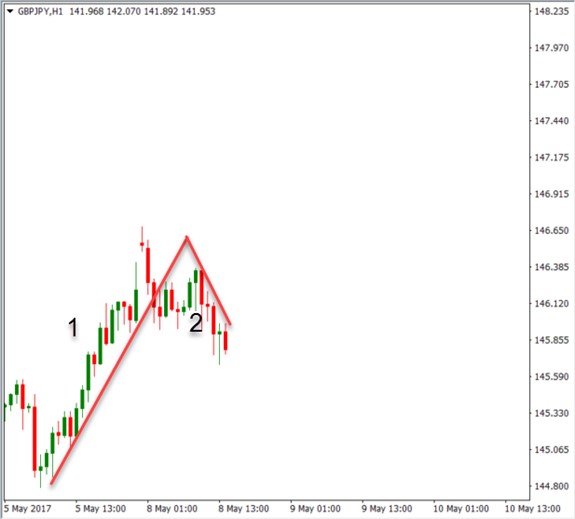
You can immediately identify that after an up-move (wave 1), the pair makes a correction move (wave 2). As you already know how Elliott waves form, you predict that the strong third wave is about to start and look for a level to enter. This is where you use the Fibonacci retracement levels, which we've covered in the previous articles. Elliott waves tend to respect Fibonacci levels for their correction moves. Let's draw the Fibonacci levels on our chart.
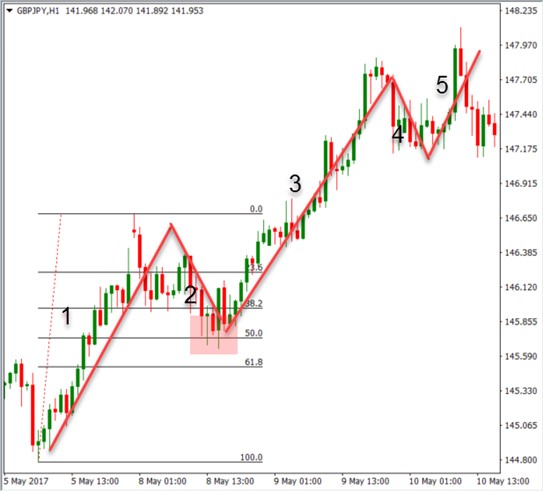
As you can see, the correction move touched the 50% Fibonacci level before it continued to trade upwards. This is where you would enter your long position (red area), and catch the third wave! A stop loss order could be placed just below the 50% Fibonacci retracement level.