The Fibonacci Sequence is a popular concept in technical analysis. Traders around the world use Fibonaccis in their daily trading, making it a tool based on self-fulfilling expectations, and that's why the price will often bounce of the Fibonacci levels. Let's start with introducing Leonardo Fibonacci, the famous Italian mathematician. He discovered a simple series of numbers that describes the proportions of things in nature and the universe. The Fibonacci series looks like this: 0, 1, 1, 2, 3, 5, 8, 13, 21, 34, 55, 89… If you look closer at the numbers above, you can conclude that each number is the sum of the previous two numbers in the series. For example, 2+3 is 5, 3+5 is 8, 8+5 is 13 and so on. This indefinite series hides something very interesting – the “golden mean”. If you divide each number with its succeeding number, you will get 0.618. For example, 5/8 is equal to 0.618, just like 55/89 is equal to 0.618. This ratio is called the “golden mean” and can be found in many places in the nature. The ratio between alternate numbers, like 34/89, will always return 0.382 as the result. Let's stop here with the math and go back to using the Fibonacci ratios in trading. There are two Fibonacci concepts in technical analysis which we will cover in this article, and they are:
- Fibonacci retracements
- Fibonacci extensions
Fibonacci retracements and extensions use similar ratios for drawing the Fibonacci tool on the chart. You don't have to know how to calculate these ratios; your charting platform will do it for you. The ratios are also derived from the Fibonacci number series, and are as follows:
- Fibonacci retracement levels: 0.236, 0.382, 0.500, 0.618, 0.764
- Fibonacci Extension Levels: 0, 0.382, 0.618, 1.000, 1.382, 1.618
How to Use Fibonacci Retracement to Enter a Forex Trade
Fibonacci retracements levels are essentially used as support and
resistance lines. The following chart shows the price bouncing off the 0.618 Fibonacci
level after a correction move, and continues its prior uptrend. To draw the Fibonacci retracement on the chart, you need to determine the
previous swing lows and swing highs. Then select the Fibonacci tool in your charting platform, and connect
these two swings. The tool will automatically draw the retracement level on the chart. The right time to enter a trade based on Fibonacci retracements, is to
wait for the price to bounce off the retracement level (usually the 0.618
or 0.382), and making sure that the next candlestick confirms the bounce. A stop-loss order should be placed just below the retracement line.
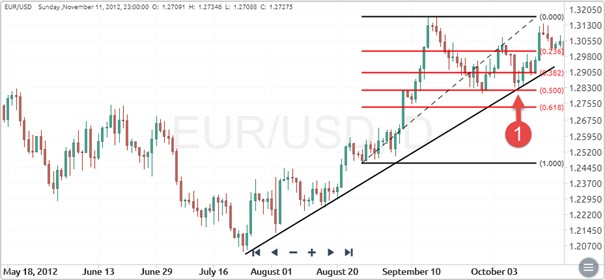
Fibonacci Retracement is NOT Foolproof!
You should also be aware that Fibonacci retracements are NOT foolproof. They
can fail just like any other support and resistance line. Let's take a
look at the following chart:

At point (1), it seems like the price will bounce of the 0.500 Fibonacci
retracement level. Even the following candlestick closes well above the
retracement level. But, just a few bars later, the price plunges and breaks
every retracement level on the chart. This shows that a trader should never
rely solely on Fibonacci retracements, because if underlying fundamentals are
strong enough, even the most important support and resistance lines will
eventually fail.
How to Use Fibonacci Retracement with Support and Resistance
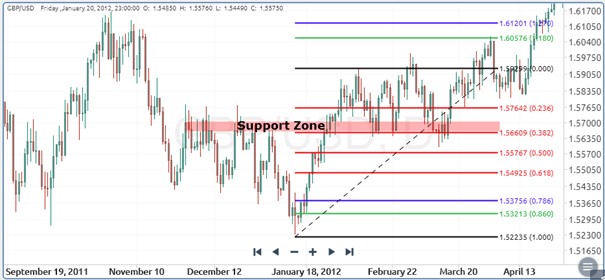
Fibonacci retracements are especially important when they form a confluence zone with a previous support or resistance level. This situation is shown on the next chart. During its correction phase, the price finds support at the 0.382 retracement level. But, it just happened that this same level matches a previous support zone, marked with the red rectangle. This is called a confluence zone and adds substantially to the importance of the Fibonacci level. The price touched the 0.382 level a few times and skyrocketed afterwards.
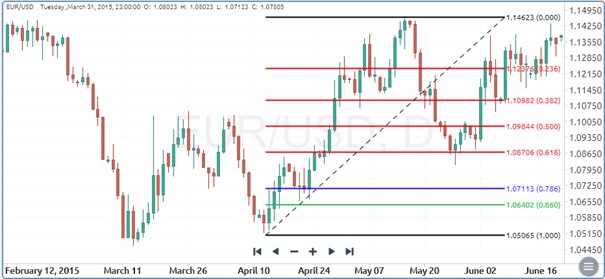
How to Use Fibonacci Retracement with Trend Lines Similar to support and resistance lines, Fibonacci retracements can also form confluence zones with trendlines. The following chart shows such a situation.
The price touched the 0.500 level at point (1), which happened to be at the same level as a previous trendline. This made a strong support at this level and the price continued to trade higher. Just like with support and resistance lines, this situation made a good trade opportunity.
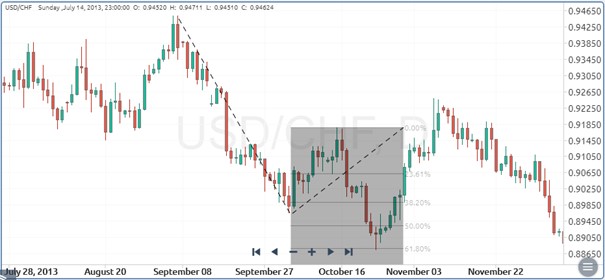
How to Use Fibonacci Retracement with Japanese Candlesticks
Another popular way to use Fibonacci retracements is with candlesticks. In this case, candlesticks are used as a confirmation signal that the price will respect the retracement level and continue its previous trend after the correction phase. The following chart shows the price touching the 0.786 retracement level, and a small red candlestick at point (1), called a spinning top. This candlestick signals a top and that the price might reverse soon. That’s our confirmation for opening a short position.

How to Use Fibonacci Extensions to Know When to Take Profit
Now that we know that Fibonacci retracement levels are used similar to support and resistance lines, it's time to introduce Fibonacci extension levels. Fibonacci extensions are used to determine when to exit a trend. They show possible targets that the price can reach after bouncing off a Fibonacci retracement. The following chart shows a Fibonacci extension used to take profits. To draw a Fibonacci extension on the chart, you need to select three points with your mouse. The swing high, swing low, and the lower high of the correction. The tool will then automatically draw each extension level on the chart. On the chart below, the price touched the 61.8% Fibonacci extension level where many traders have put their take profit order.
How to Use Fibonacci to Place Your Stop so You Lose Less Money
Fibonacci levels are not only used to determine possible price reversals and take profit levels, but also for stop-loss levels to minimize possible losses. Stop-loss orders are usually put just above (in a downtrend) or below (in an uptrend) of the Fibonacci retracement levels. Let's take a look at the following chart.
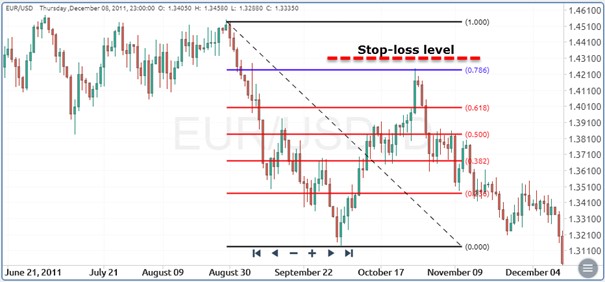
After the spinning top candlestick confirmed our short position, we've put a stop-loss order just above the 0.786 retracement level. If the price breaks above the 0.786 level, the stop-loss order will prevent further losses.